Core Web Vitals Explained: LCP, INP, CLS and How to Measure Them
Short answer
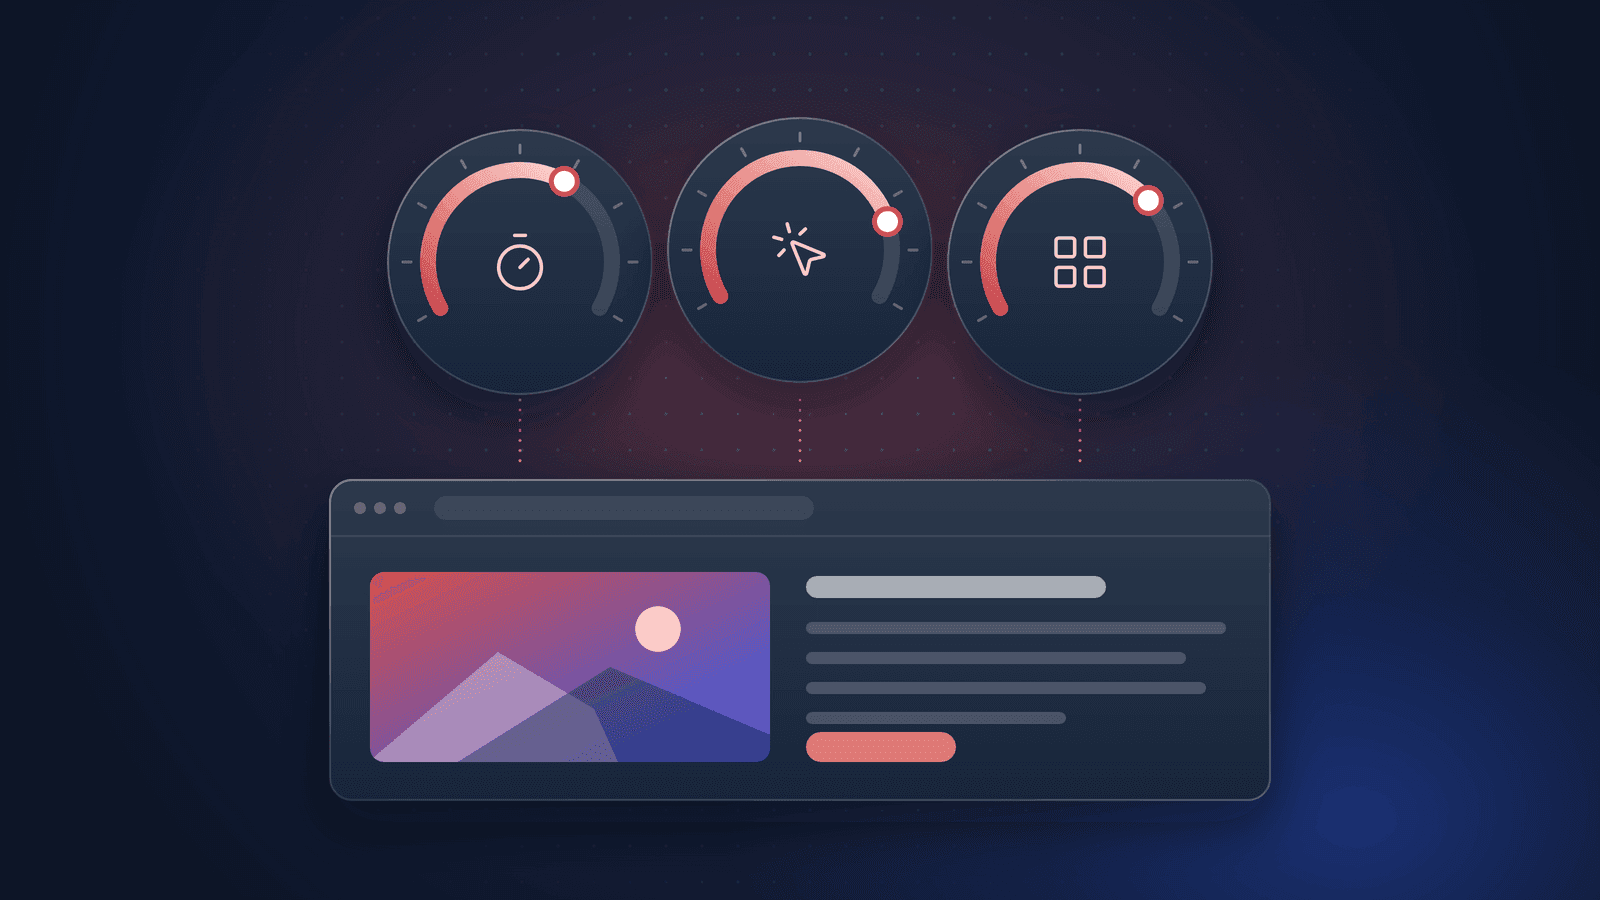
Core Web Vitals are three Google-defined metrics of real-user experience: Largest Contentful Paint (loading, good at 2.5 seconds or less), Interaction to Next Paint (responsiveness, good at 200 milliseconds or less) and Cumulative Layout Shift (visual stability, good at 0.1 or less). A page passes when all three are good at the 75th percentile of visits.

Written by Bryce Daly
Published · 12 min read
On this page
LCP, INP and CLS in plain English: what each measures, the thresholds Google uses at the 75th percentile, why lab and field numbers differ and what to fix first.
Core Web Vitals show up everywhere: in Search Console, in PageSpeed Insights, in agency reports. Yet the same page can be "good" in one tool, "poor" in another and different again in your own test. Most of the confusion comes from three things: mixing up field data with lab data, forgetting that the official thresholds apply to the 75th percentile of real visits, and reading guides written before Interaction to Next Paint replaced First Input Delay.
This guide explains what Largest Contentful Paint (LCP), Interaction to Next Paint (INP) and Cumulative Layout Shift (CLS) measure, using the definitions and thresholds Google publishes on web.dev and in Search Console's documentation. By the end you will be able to read any Core Web Vitals report correctly, tell which metric fails on which device, find the likely cause and apply the first fix. You will also see what a single lab run really tells you, using a measurement we made ourselves.
- Core Web Vitals are LCP (loading), INP (responsiveness) and CLS (visual stability). INP replaced First Input Delay on March 12, 2024.
- Good means LCP at or below 2.5 seconds, INP at or below 200 milliseconds and CLS at or below 0.1, measured at the 75th percentile of visits, separately for mobile and desktop.
- Field data from real Chrome users decides your status; lab data from one simulated load explains causes. They often disagree, and both can be right.
- A page load in the lab cannot produce INP. Total Blocking Time is the lab proxy, not a substitute.
- Google says Core Web Vitals are used by its ranking systems, and also that good scores do not guarantee top rankings.
What Core Web Vitals are, and what changed in 2024
Web Vitals is a Google initiative that gives unified guidance on quality signals for the web. The Core Web Vitals are the subset that, according to web.dev, apply to all web pages, should be measured by all site owners and appear across Google's tools. Each one covers a distinct part of the experience and can be measured in the field, meaning on real visits.
The set is not frozen: web.dev states that stable Core Web Vitals change at most once per year. The biggest change so far came on March 12, 2024, when INP replaced First Input Delay (FID), a date Google's Search Central blog also records in its update to the INP announcement. FID only measured the input delay of the first interaction; INP observes every click, tap and key press up to the next paint. Chrome gave developers until September 9, 2024 to move off FID in the CrUX and PageSpeed Insights APIs, so any report still built around FID is out of date.
Thresholds and the 75th percentile
Every metric has three bands. The values below are the ones web.dev publishes for each metric and the ones the Search Console Core Web Vitals report uses for its statuses.
| Metric | What it measures | Good | Needs improvement | Poor |
|---|---|---|---|---|
| LCP (Core) | When the largest image, video or text block in the viewport is rendered | ≤ 2.5 s | ≤ 4.0 s | > 4.0 s |
| INP (Core) | Latency of clicks, taps and key presses until the next paint | ≤ 200 ms | ≤ 500 ms | > 500 ms |
| CLS (Core) | The largest burst of unexpected layout shifts | ≤ 0.1 | ≤ 0.25 | > 0.25 |
| TTFB (supporting) | Time until the first byte of the HTML arrives | ≤ 0.8 s (a rough guide) | ≤ 1.8 s | > 1.8 s |
| FCP (supporting) | When any text or image is first painted | ≤ 1.8 s | ≤ 3.0 s | > 3.0 s |
| TBT (lab only) | Main-thread time blocked by long tasks after FCP | < 200 ms on average mobile hardware | No further bands published on web.dev | |
The thresholds are not meant for a single visit. web.dev recommends measuring at the 75th percentile of page loads, segmented across mobile and desktop, and considers a page passing when all three Core Web Vitals meet their targets at that percentile. Put simply: at least three out of four visits need a good experience.
Search Console applies this to groups of similar URLs: "Group LCP" is the value 75% of visits reached or beat in the last 28 days. A group's status is its worst metric, so poor CLS makes the whole group poor even with good LCP and INP. Groups without enough data for both LCP and CLS are left out or folded into an origin-level group, and only indexed URLs appear at all (if a page is missing, check why it is not indexed).
Watch the boundary wording. web.dev and the Search Console status table say "or less" (≤), so exactly 200 ms or exactly 0.1 is good. Google's Search Central overview phrases the INP and CLS targets as "less than". The difference only matters for values sitting exactly on the line.
What each metric actually measures
Largest Contentful Paint (LCP)
LCP reports the render time of the largest image, text block or video visible in the viewport, measured from the start of navigation. Candidates are <img> elements, <image> inside SVG, videos, elements with a CSS background image loaded through url() and block-level text. Two details explain many surprises: LCP includes redirect time, connection setup and TTFB, so a slow server or redirect chain shows up as slow LCP; and the browser stops looking for new candidates once the user taps, scrolls or presses a key, one reason field LCP can beat lab LCP.
Interaction to Next Paint (INP)
INP observes the latency of every click, tap and keyboard interaction during the whole visit. Hovering, scrolling and zooming are not counted. Each interaction's latency runs from the user's input to the moment the browser can paint the next frame, so it includes the input delay (waiting for the main thread), the processing time of the event handlers and the presentation delay. The page's INP is the longest interaction, ignoring one outlier for every 50 interactions. A visit with no qualifying interaction produces no INP value at all.
Cumulative Layout Shift (CLS)
A layout shift happens when a visible element changes its start position between two frames. Each shift is scored as impact fraction times distance fraction: how much of the viewport the moving elements cover, multiplied by how far they moved. CLS groups shifts into session windows (shifts less than one second apart, five seconds at most) and reports the largest window. Shifts within 500 milliseconds of a tap, click or key press are excluded as expected; scrolling does not count as such input. In the field CLS covers the whole life of the page, not just loading.
Supporting metrics: TTFB, FCP and TBT
These are not Core Web Vitals, but they explain them. TTFB adds up redirects, DNS lookup, connection setup and the wait for the first byte; web.dev calls its 0.8-second mark a rough guide. FCP marks the first text or image on screen. A large gap between TTFB and FCP points to render-blocking resources; a large gap between FCP and LCP points to a late main element.
Total Blocking Time adds up, for every task longer than 50 milliseconds after FCP, the part beyond those first 50 milliseconds. In web.dev's own example, five tasks with 560 milliseconds of main-thread work produce 345 milliseconds of TBT. A low TBT often goes with a low INP, but web.dev is explicit that TBT is a lab proxy and "not a substitute" for INP: it can flag blocking that real users never run into and miss delays that are not long tasks.
Field data vs lab data
Field data comes from real visits. Lab data comes from loading the page once in a controlled environment. web.dev's guide to the differences sums up the rule: when you have both, use field data to decide what to work on and lab data to find out why.
| Field data | Lab data | |
|---|---|---|
| Source | Real Chrome users (CrUX) or your own real-user monitoring | One page load with a predefined device, network and location |
| Shows | A distribution, reported at the 75th percentile over 28 days | Single values for one load, plus the resources behind them |
| INP | Yes, from real interactions | Not from a plain load; TBT stands in |
| CLS | Whole visit, including shifts while scrolling | Loading only |
| Best for | Deciding status and priorities | Diagnosing causes and testing fixes before release |
Not every page has field data. The CrUX methodology only includes pages and origins that are publicly discoverable (HTTP 200 after redirects, no noindex) and sufficiently popular, with the threshold undisclosed. Experiences come from opted-in users of desktop Chrome and Chrome for Android; Chrome on iOS, Android WebView and other Chromium browsers such as Edge do not contribute. Lab and field values also drift apart for documented reasons: different screens produce different LCP elements, real visitors often have resources cached, and field CLS and INP depend on what people do after load.
What one lab run looks like: our measurement
On October 31, 2026 we ran Backlnk's Page Speed Test once per profile on https://www.w3.org/WAI/. The mobile profile emulates a 412 × 823 touch viewport with a 4× CPU slowdown, 150 ms of added round-trip latency and 1.6 Mbps down / 750 kbps up; the desktop profile uses a 1366 × 900 viewport with no throttling. These are the exact values from the report.
| Metric (one lab run each) | Emulated mobile | Desktop |
|---|---|---|
| TTFB | 323.9 ms | 380.5 ms |
| FCP | 1,092 ms | 572 ms |
| LCP | 1,124 ms | 644 ms |
| CLS | 0.002 | 0.0138 |
| TBT | 750 ms (8 long tasks) | 0 ms (no long tasks) |
| LCP element | A paragraph in the introduction | A paragraph in a news item |
Loading and layout stability were within the good thresholds on both profiles. The 4× CPU slowdown, however, turned the same scripts into eight long tasks and 750 ms of TBT on mobile, far above web.dev's 200 ms mark, while desktop had none. That does not reveal the page's INP, which only field data can, but it shows where to look if field INP were poor. Note also that the LCP element changed with the viewport, and that TTFB was lower in the throttled run than in the unthrottled one: a single run carries network noise, so compare trends, not single milliseconds.
How Google Search uses Core Web Vitals
Google's Core Web Vitals documentation describes the metrics as measuring real-world user experience and "highly recommend[s]" good Core Web Vitals for success with Search. The page experience FAQ adds the important limits:
- There is no single "page experience signal". Core Web Vitals are used by Google's ranking systems, but good results in Search Console or third-party tools do not guarantee top rankings.
- Chasing a perfect score just for SEO reasons "may not be the best use of your time".
- Google still shows the most relevant content even if its page experience is sub-par; where many helpful pages compete, a great page experience can contribute.
"A perfect score lifts rankings." Google's own documentation says the opposite: passing Core Web Vitals is not a guarantee, and relevance comes first. Our reading of the documentation: fix pages in the poor band first, especially templates with many visits, and treat further gains as user-experience work rather than a ranking lever.
A measurement workflow that works
Start with field data. In Search Console's Core Web Vitals report, look at mobile and desktop separately and note which metric makes each URL group fail.
Check the URL in PageSpeed Insights. Its upper section shows CrUX data for the URL or, with too little traffic, for the whole origin. Check which one you are looking at.
Identify the element or interaction. For LCP, find the element and the slow part of its loading. For CLS, find what moves; if a lab run shows little shift, it probably happens after load. For INP, find the slow interaction with real-user monitoring or by interacting while the page loads.
Reproduce it in the lab. Use the Chrome DevTools Performance panel, Lighthouse or Backlnk's Page Speed Test to see the LCP element, long tasks and render-blocking resources.
Fix, then re-test with the same profile. Compare the direction of the change before and after, on the same device profile.
Validate in the field. In Search Console, open the issue and click Start Tracking. This starts a 28-day monitoring period of CrUX data; it does not trigger recrawling or reindexing.
Field data moves slowly because it covers a rolling 28 days. Expect a fix to show up gradually in Search Console, and use the lab test in the meantime to confirm the cause is gone.
Common causes of poor values, and the first fixes
Poor LCP
web.dev's LCP optimization guide splits every LCP into four parts with no gaps or overlap. On a well-optimized page, most of the time goes to the two network parts:
- TTFBAbout 40% of LCP on a well-optimized page
- Resource load delayUnder 10%: the wait before the LCP image starts downloading
- Resource load durationAbout 40%: downloading the image itself
- Element render delayUnder 10%: the wait between download and paint
The first fixes follow from that breakdown:
- Make the LCP image discoverable in the initial HTML with
<img src>orsrcset. Images injected by JavaScript, hidden indata-srcor used as CSS backgrounds without a preload start late. - Give it
fetchpriority="high"; web.dev notes that marking more than one or two images this way makes the hint unhelpful. - Reduce render-blocking stylesheets and remove synchronous scripts from the
<head>. - Cut TTFB: serve cached pages from a CDN and avoid sending visitors through redirect hops (see 301 vs 302 redirects for clean redirect setups).
- Compress and resize the image. web.dev's research found load duration is often not the main bottleneck, so check the delays first.
<img src="/images/hero-1200.webp"
     srcset="/images/hero-800.webp 800w, /images/hero-1200.webp 1200w"
     sizes="100vw"
     width="1200" height="675"
     fetchpriority="high"
     alt="Technician checking a rooftop solar panel">
Never put loading="lazy" on the LCP image. web.dev states that lazy-loading it always adds resource load delay, because the browser waits for layout before it starts the download. Lazy loading belongs on images below the first viewport.
Poor INP
According to web.dev's INP optimization guide, slow interactions usually come from long tasks that delay the input (often script evaluation during load), heavy event handlers, forced synchronous layout and expensive rendering on large DOMs. First fixes: break up long tasks and yield to the main thread, do only the visual update before the next paint and defer the rest, load less JavaScript (including third-party tags), and keep the DOM small.
Poor CLS
web.dev's CLS guide names the usual causes: images, ads, embeds and iframes without dimensions, content injected above existing content, and web fonts. First fixes: set width and height (or CSS aspect-ratio) on every image and video, reserve space for ads and embeds with min-height, show banners as overlays or in reserved space, preload critical fonts with closely matched fallbacks, and animate with transform rather than layout properties.
Check a page with Backlnk's Page Speed Test
The Page Speed Test is a lab test. It loads the page once on emulated mobile (4× CPU slowdown, 150 ms added latency, 1.6 Mbps down and 750 kbps up) and once on desktop (no throttling) in an isolated Chromium, and reports:
- LCP, CLS, TBT, FCP and TTFB for both profiles, banded against web.dev's thresholds (the "poor" band for TBT is a disclosed Backlnk choice, since web.dev defines only "good").
- The LCP element, and whether an LCP image is lazy-loaded, lacks
fetchpriority="high"or is missing from the initial HTML. - Render-blocking resources, the largest resources, requests and bytes by type, third-party weight and uncompressed text responses.
- Server response time and the number of long tasks and layout shifts.
What it does not do: it does not measure INP, which needs real interactions, and it includes no CrUX field data. Each profile is one run, so values vary between runs. Its TBT window ends when measurement stops rather than at Time to Interactive, so the number is not directly comparable with Lighthouse, and its score counts passed checks rather than reproducing a Lighthouse score. Use it to find causes and confirm fixes, and Search Console to confirm the result for real users. For a site-wide check, the free full audit runs Backlnk's tools together and sends the report by e-mail.
Next step
Take the worst URL group in Search Console's Core Web Vitals report, note the failing metric and device, and run one of its example URLs through the Page Speed Test. If the lab shows the same problem, apply the first fix, re-test and start validation.
Frequently asked questions
- What replaced First Input Delay?
- Interaction to Next Paint (INP) replaced First Input Delay as the Core Web Vital for responsiveness on March 12, 2024. FID only measured the input delay of the first interaction. INP observes all clicks, taps and key presses during a visit and includes the time until the browser paints the next frame.
- Why do PageSpeed Insights and Search Console show different numbers?
- They report different things. The upper part of PageSpeed Insights shows CrUX field data for one URL or, with too little traffic, for the whole origin, and the lower part shows one Lighthouse lab run. Search Console shows the 75th percentile for groups of similar URLs over the last 28 days.
- Can a lab test measure INP?
- Not from a page load alone, because INP needs real interactions such as clicks, taps and key presses. Lab tools report Total Blocking Time instead. Google's web.dev documentation describes TBT as a reasonable proxy for INP in the lab but not a substitute for measuring INP in the field.
- Do good Core Web Vitals guarantee better rankings?
- No. Google states that Core Web Vitals are used by its ranking systems, but good results in Search Console or third-party tools do not guarantee top rankings, and Google still shows the most relevant content even when its page experience is not ideal.
- Why does my page have no Core Web Vitals data?
- Field data comes from the Chrome UX Report, which only includes publicly discoverable pages and origins with enough eligible Chrome visits. Search Console also leaves out URL groups without enough data for both LCP and CLS and may show an origin-level group instead. Until then, use lab tests to find problems.
How this article was produced
- Byline
- Bryce Daly
- First published
- Evidence
- External research (cited below)
- Observed results from our own data or tests
- Editorial interpretation
Sources
- Web Vitals, web.dev (Google Chrome team) (accessed Oct 31, 2026)
- Largest Contentful Paint (LCP), web.dev (Google Chrome team) (accessed Oct 31, 2026)
- Interaction to Next Paint (INP), web.dev (Google Chrome team) (accessed Oct 31, 2026)
- Cumulative Layout Shift (CLS), web.dev (Google Chrome team) (accessed Oct 31, 2026)
- Time to First Byte (TTFB), web.dev (Google Chrome team) (accessed Oct 31, 2026)
- First Contentful Paint (FCP), web.dev (Google Chrome team) (accessed Oct 31, 2026)
- Total Blocking Time (TBT), web.dev (Google Chrome team) (accessed Oct 31, 2026)
- Interaction to Next Paint is officially a Core Web Vital, web.dev (Google Chrome team) (accessed Oct 31, 2026)
- Introducing INP to Core Web Vitals (with updates of January 31 and March 12, 2024), Google Search Central Blog (accessed Oct 31, 2026)
- Understanding Core Web Vitals and Google search results, Google Search Central (accessed Oct 31, 2026)
- Understanding page experience in Google Search results, Google Search Central (accessed Oct 31, 2026)
- Core Web Vitals report, Search Console Help (accessed Oct 31, 2026)
- Why lab and field data can be different (and what to do about it), web.dev (Google Chrome team) (accessed Oct 31, 2026)
- CrUX methodology, Chrome for Developers (accessed Oct 31, 2026)
- Optimize Largest Contentful Paint, web.dev (Google Chrome team) (accessed Oct 31, 2026)
- Optimize Interaction to Next Paint, web.dev (Google Chrome team) (accessed Oct 31, 2026)
- Optimize Cumulative Layout Shift, web.dev (Google Chrome team) (accessed Oct 31, 2026)

Keep reading

Page Not Indexed? How to Find the Exact Cause, Step by Step
A step-by-step way to find why Google hasn't indexed a page: read the Search Console status, check the signals in the right order, fix the cause and confirm it.

301 vs 302 Redirects: Which to Use and How Google Treats Them
What 301, 302, 303, 307 and 308 redirects mean, how Google treats each one, why permanent redirects get cached, and how to pick the right code every time.